Use AWS X-Ray for call graph and timing
You’re a pro at the application architecture. But do you know how long it takes to load your pages? Or, where the time is spent in processing your requests? Or even the dependencies between the different services and Lambda functions? The Bookstore Demo’s application architecture is sending all of this information to AWS X-Ray.
AWS X-Ray is a service that collects data about requests that your application serves, and provides tools you can use to view, filter, and gain insights into that data to identify issues and opportunities for optimization.
X-Ray is distributed tracing on the AWS cloud. If you’re not familiar with distributed tracing, here are a few key concepts:
- Segments the resources in your application send data about their work as segments. A segment provides the resource’s name, details about the request, and details about the work done.
- Subsegments break down the work of a segment into finer granularity. They include timing information and downstream calls for segments.
- Traces A trace ID tracks the path of a request through your application. A trace collects all the segments generated by a single request.
A benefit of building a serverless application is that every AWS Lambda function can send trace data to X-Ray. You can enable this tracing with a simple, “check-box” Boolean.
The Bookstore Demo App comes with X-Ray enabled for all of its API functions and services. While you’ve been playing with the demo, you’ve been generating trace data!
- Find the
FunctionListOrdersin the CloudFormation template. Scroll down to the TracingConfig. Setting this toActiveis all it takes to generate the X-Ray data you’ll examine in a minute.
Your Service Graph
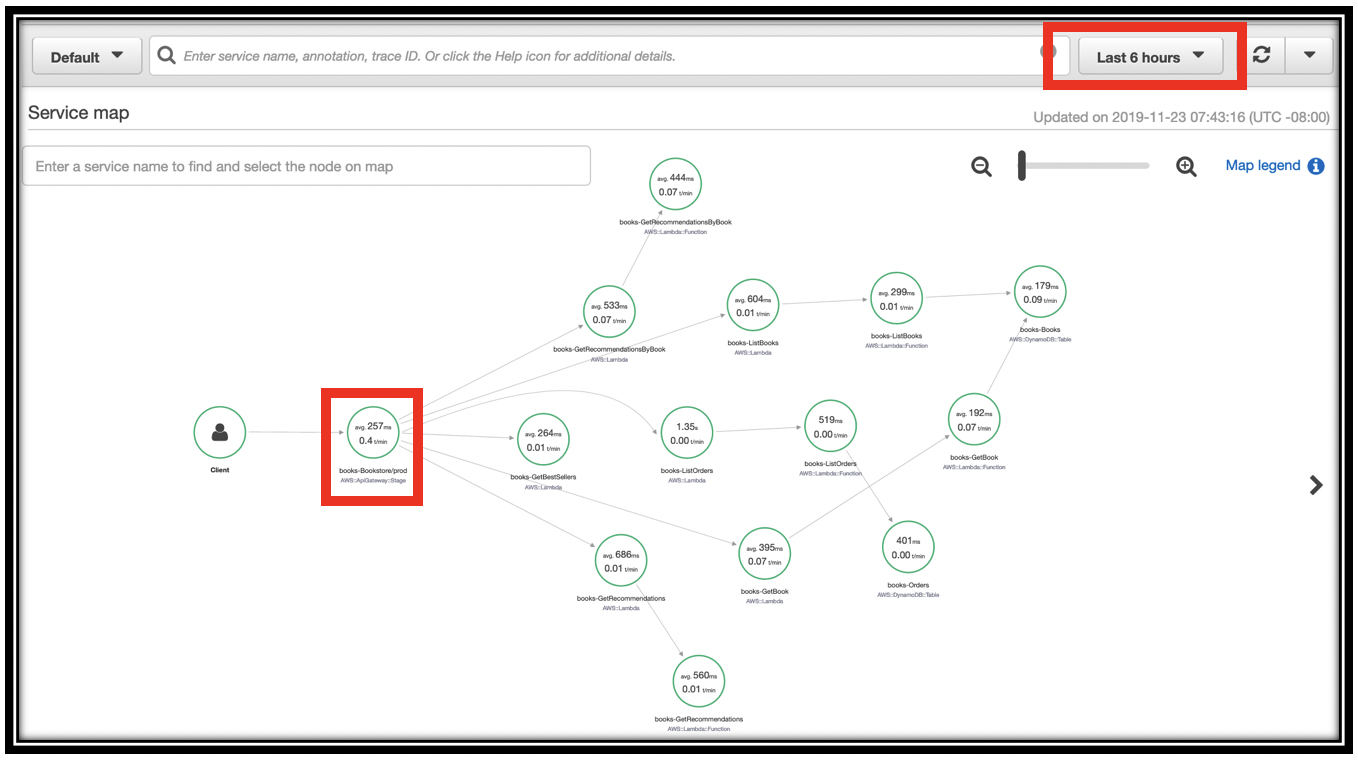
X-Ray uses the data that your application sends to generate a service graph. Each AWS resource that sends data to X-Ray appears as a service in the graph. Edges connect the services that work together to serve requests. Edges connect clients to your application, and your application to the downstream services and resources that it uses.
- Navigate to the X-Ray console. Make sure Service map is selected in the left navigation pane.
- The console initially starts with a 5 minute window. If you don’t have data, use the time selector at the top-right of the screen to expand the time.
- Zoom in to the leftmost node in the graph (the Client node). Traffic from the client moves to Amazon API Gateway, to the right.
- Click the <project name>-Bookstore/prod node. This reveals aggregate timing information from all of the API calls you’ve made.
Continue exploring the service graph to see the different calls you made, and the services they invoked. Direct children of the API Gateway node are the Lambda functions backing your API. I have <project name>-GetBestSellers, <project name>-GetBook, <project name>-ListOrders and many more.
You can see throughput, timing, and error information at each level of the tree. For instance, <project name>-ListOrders calls AWS Lambda for the <project name>-ListOrders function. AWS Lambda then invokes the <project name>-ListOrders function (next node). The function calls Amazon DynamoDB (leaf node)
Click one of these nodes to see details on the timing
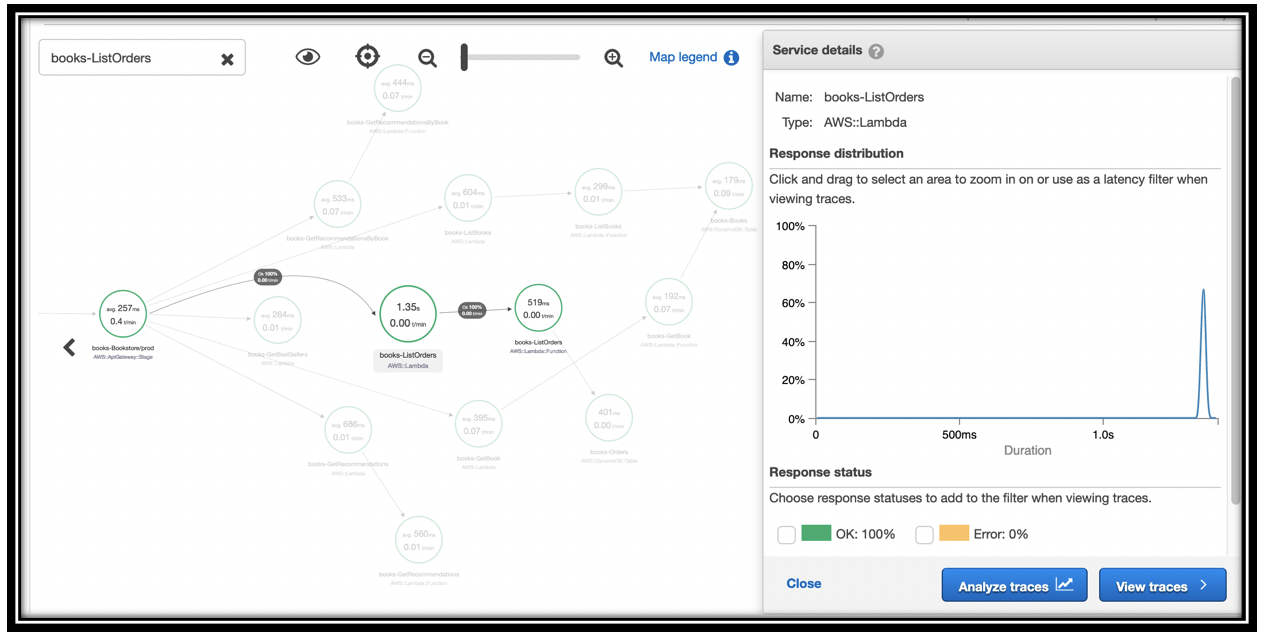
In my case, I only called ListOrders once, taking 1.35s. You can see that the downstream function call time is 519ms.
Continue to explore the service map to get a visual feel for how the Bookstore Demo App is constructed, the dependencies, and timing and latency.
Explore traces
The segment map is a way to visualize an overview of your API request processing. To get deeper information, you explore traces.
- Navigate to the Bookstore home page.
- Type Lamb in the search bar and press enter. You receive one search result
- Navigate to the X-Ray console
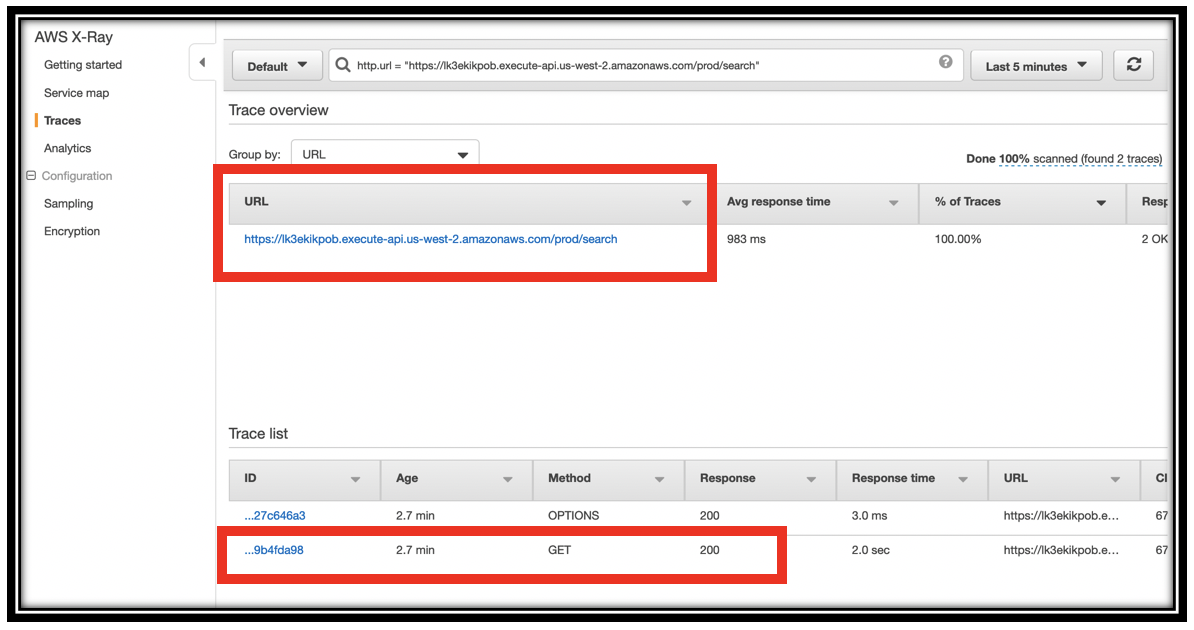
- Select Traces from the left navigation pane.
- Set the time selector to Last 5 minutes.
- Locate and click https://<application endpoint>.execute-api.us-west-2.amazonaws.com/prod/search in the URL section of the page.
You will have 2 traces one for the OPTIONS method and one for the GET method. Click the ID for the trace of the GET method.
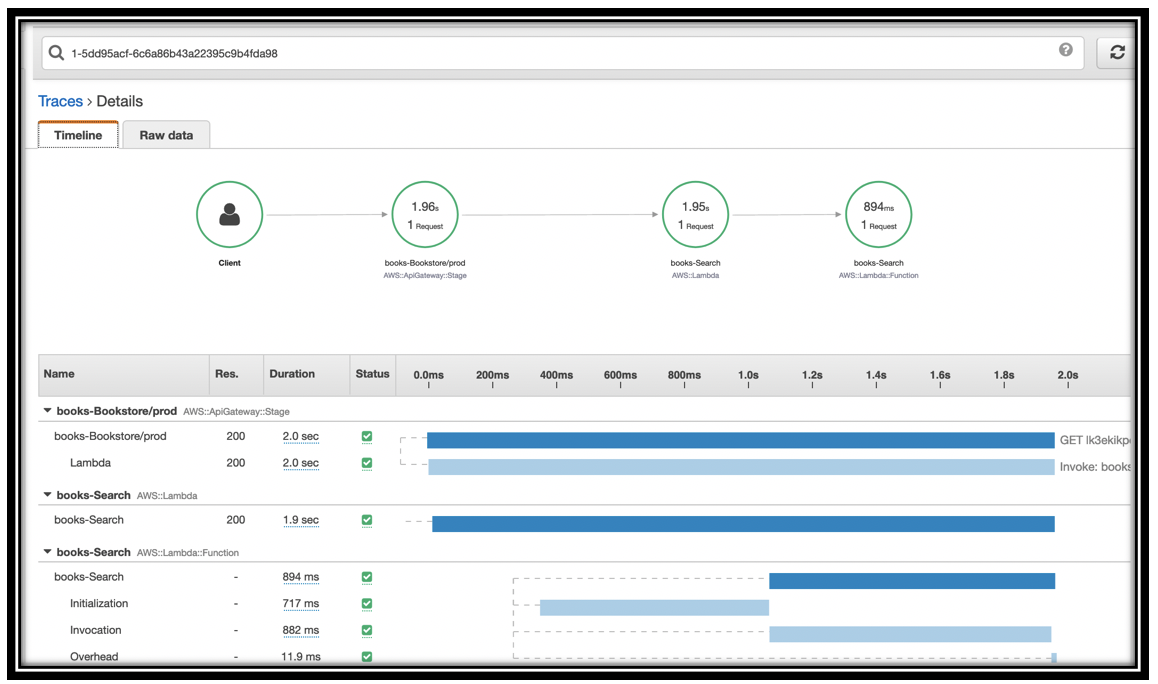
Look at the details for this trace. At the top, you can see the call graph for just this function. The <project name>-Bookstore/prod time is completely covered by the call to Lambda.
The <project name>-Search Lambda function details show the Initialization time, the Invocation time, and a small amount of overhead. In my case, Initialization took almost as long as Invocation.
Return to the Bookstore home page and search for Cookbooks.
Return to the Traces tab, and find this second request. You can see that the time has reduced considerably (in my case, 700ms, down from 2.5s). The Lambda function is warm.
Troubleshoot a slow function
Let’s simulate a problem with the Bookstore’s <project name>-Search function.
- Navigate to the AWS Lambda console.
- Type <project name>-Search in the search bar (*be sure to replace <project name> with your project’s name.
- Click the URL for your function.
To simulate a problem, add the following code, right after the
start = int(time.time())statementif event["queryStringParameters"]["q"] == "Cookbooks": time.sleep(5)Click Save to save the function.
This simulates a condition where a particular query runs slowly.
Return to the Bookstore home page. and search for Lamb, Databases, Floor, and Cookbooks (a few times)
Note: you must return to the bookstore home page before each search. The search results page is not correctly configured to execute searches.Navigate to the X-Ray console.
Select the Analytics tab in the left navigation pane.
Set the time selector to Last 5 minutes (or a time period covering the searching you just did).
You can see a bimodal distribution of response times.
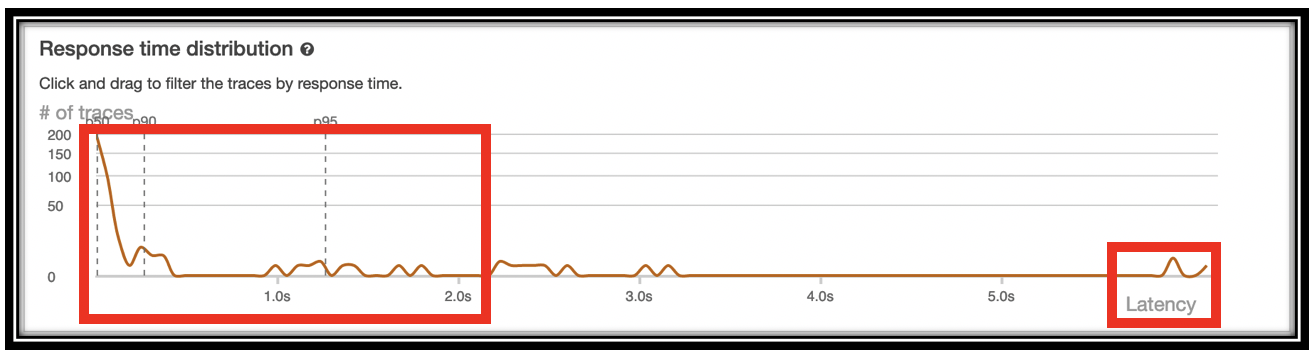
Click and drag on the timeline for the high latency requests to filter to that latency window
Examine the Time series activity panel to see when these requests occurred and how they compare with the other requests, both concurrent and historically.
Scroll down further to the Trace list pane.
You can see your requests, with latencies all higher than 5 seconds. These are all invocations of the search function. In normal debugging, you would go to the Search function, instrument it further and/or explore Amazon Elasticsearch Service logs to fix the problem.
Select one of the traces to view the Trace details page.
Click the Raw data tab.
Review the data and structure of the trace, its segments, and its subsegments.
That’s an excellent segue to the next section, where you’ll dig deep into the performance of your application with Amazon ES.
You’ve barely scratched the surface of distributed tracing. While the information provided is very useful, the automatic instrumentation is shallow. Where it gets really interesting is when you add your own tracing information via the X-Ray SDK.
Troubleshoot an error
When you deploy the Bookstore, CloudFormation can complete before Neptune has fully stabilized. In that case, you might see “Network error” dialogs. If this is already happening… don’t worry! It will stop once Neptune is fully available. You can troubleshoot this problem with X-Ray.
If this is not happening to you… don’t worry! You’ll simulate that issue now.
- Navigate to the Lambda console.
- Type books-GetRecommendations in the Functions text box.
- Click books-GetRecommendations.
- Scroll down to the code editor and locate the
response = {...specification. Just before that, add the following code:
raise Exception("Oops")Save the function.
Return to the Bookstore home page, and reload the page. You will receive an error dialog.
Reload the page several more times.
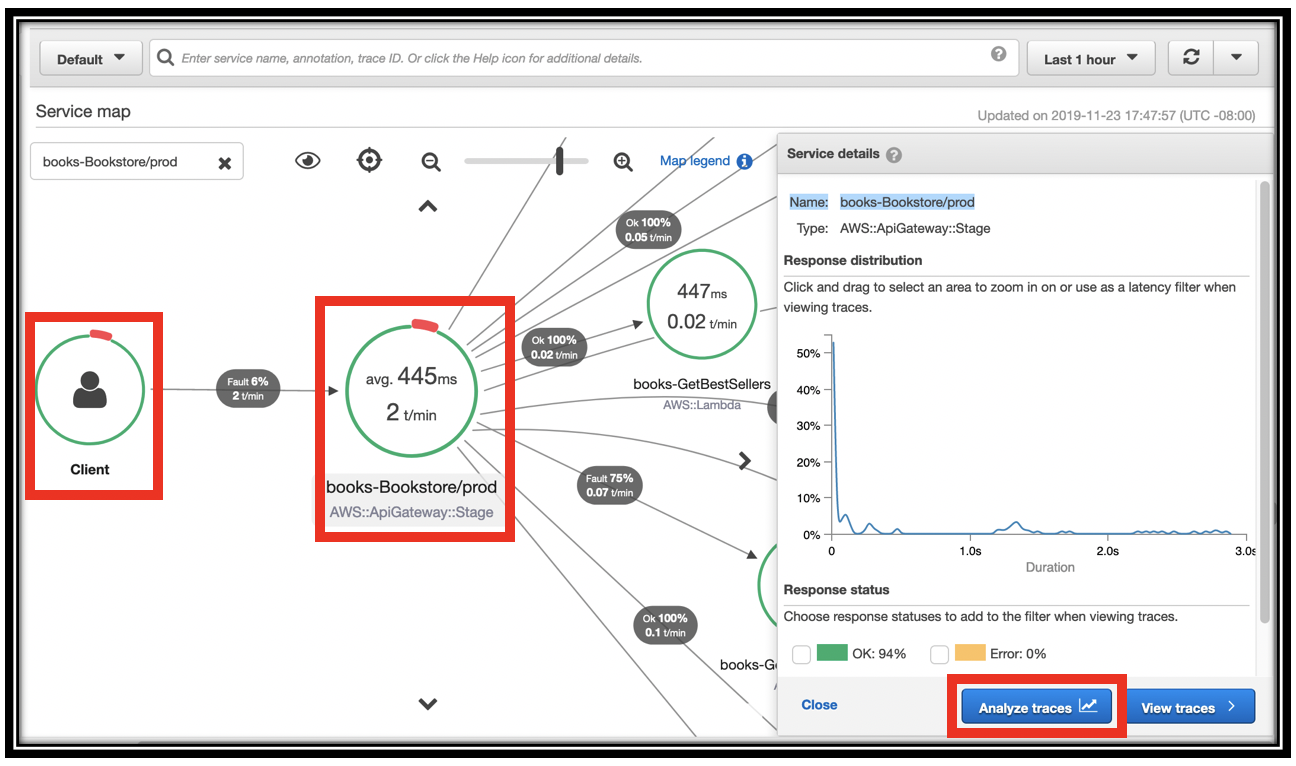
Go to the X-Ray console, Service map.
You should see that the green circle around the Client now has a small red bar.
Click the <project name>-Bookstore/prod node in the graph.
Click Analyze traces.
Scroll down to the HTTP STATUS CODE section.
Click the row for status code 502.
Scroll to Trace list at the bottom of the page. By inspection, you can see that the problem is with the recommendations API.
Click one of the traces to see the details. You can see that the call to <project name>-GetRecommendations has a status code of 502, and the Lambda duration is pending.
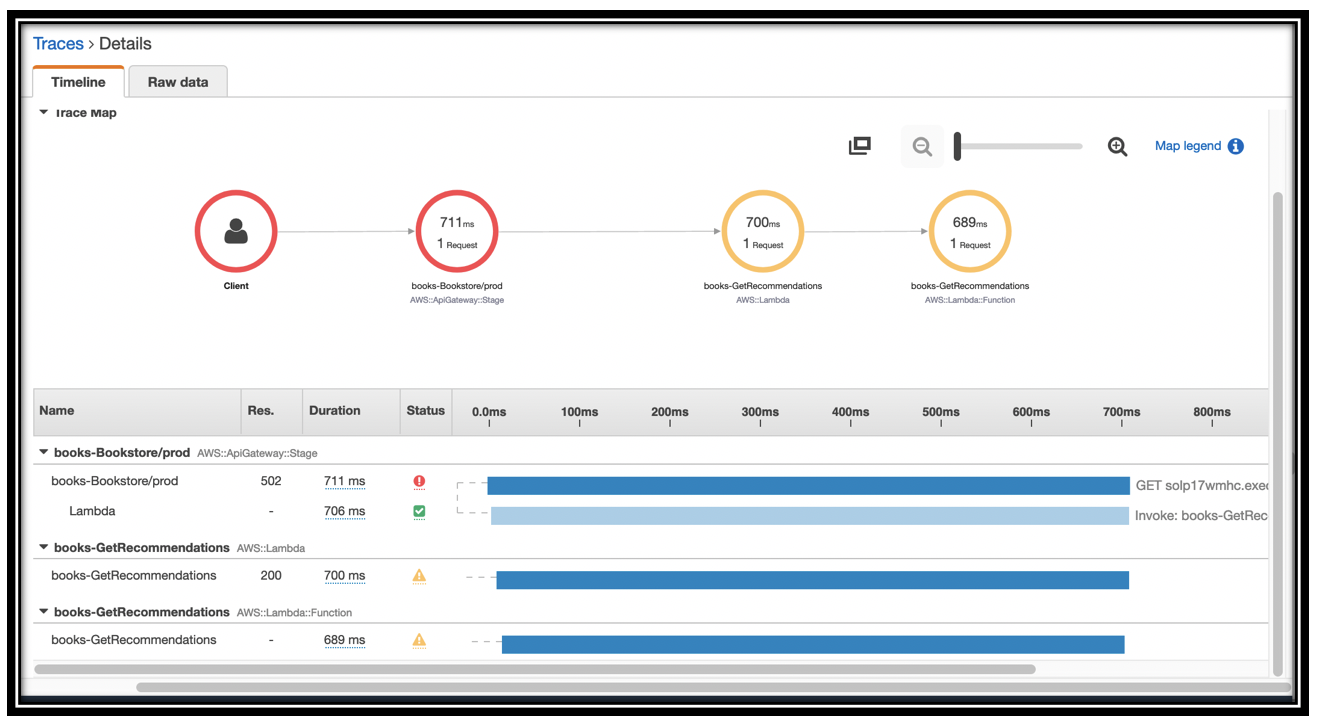
You can click the yellow triangle to see the raw details of the error.
Before continuing to the next section, remove the
Exceptionfrom theGetRecommendationsfunction and save it.