Explore the ingest architecture
The Bookstore Demo uses an Amazon Simple Queue Service (SQS) queue to forward trace information from X-Ray and logging information from the functions backing the API to Amazon Elasticsearch service.
The Bookstore Demo is deployed in an Amazon Virtual Private Cloud (VPC). To enhance security, the VPC does not have an Internet Gateway or a NAT Gateway to allow traffic in or out of the VPC. For demo purposes, we chose to host the logging infrastructure outside of the VPC to make it easy to access Amazon ES and Kibana.
In a production deployment, the logging infrastructure should all reside within a VPC. Provide access to Kibana with a tightly-secured NAT gateway and a proxy for the Amazon ES domain.
Open the CloudFormation template.
- You can find the queue definition by searching for LoggingQueue.
- Follwing the LoggingQueue, you will find a VPC endpoint definition along with a security group. This allows the Lambda functions to communicate with SQS from within the VPC.
- Further down, you can find the XRayPullerFunction this function calls X-Ray’s API, parses and forwards the trace and segment information to SQS. The template also defines a scheduled event to run the X-Ray puller every minute.
- The SQSPullerLambda, which runs outside of the VPC, retrieves items from the queue and forwards them to Amazon ES.
- The AnalyticsElasticsearchDomain defines the endpoint for log shipping. It’s also hosted outside the VPC
Set up Kibana
The Bookstore Demo uses Amazon Cognito to provide authentication and access control for the logging domain. For the purposes of the demo, we used the same User and Identity pools that support login for the app. Of course, in a real deployment, you’ll use a separate User and Identity pool to provide access for your own staff (as opposed to your end users!). Using the same pool has the advantage that you can log in to Kibana with the same credentials you used to log in to the app.
- Navigate to the Amazon Elasticsearch Service console.
- Find and click the <project name>-logs domain in the left navigation pane.
- Click the Kibana URL.
- In the sign in dialog, enter the Email and Password for the account you created in the Bookstore app.
- You’ll see a welcome screen. Click Explore on my own
In order to work with the data in Amazon ES, you need to tell Kibana the index patterns for that data. Kibana retrieves the mapping for each of these index patterns. It uses the mapping when deciding, for example, whether you can sum the values in a particular field (are they numbers?). Your first step in Kbana is to create these index patterns. You do this on the settings tab.
- Click the
 icon in the left navigation pane to navigate to the settings pane.
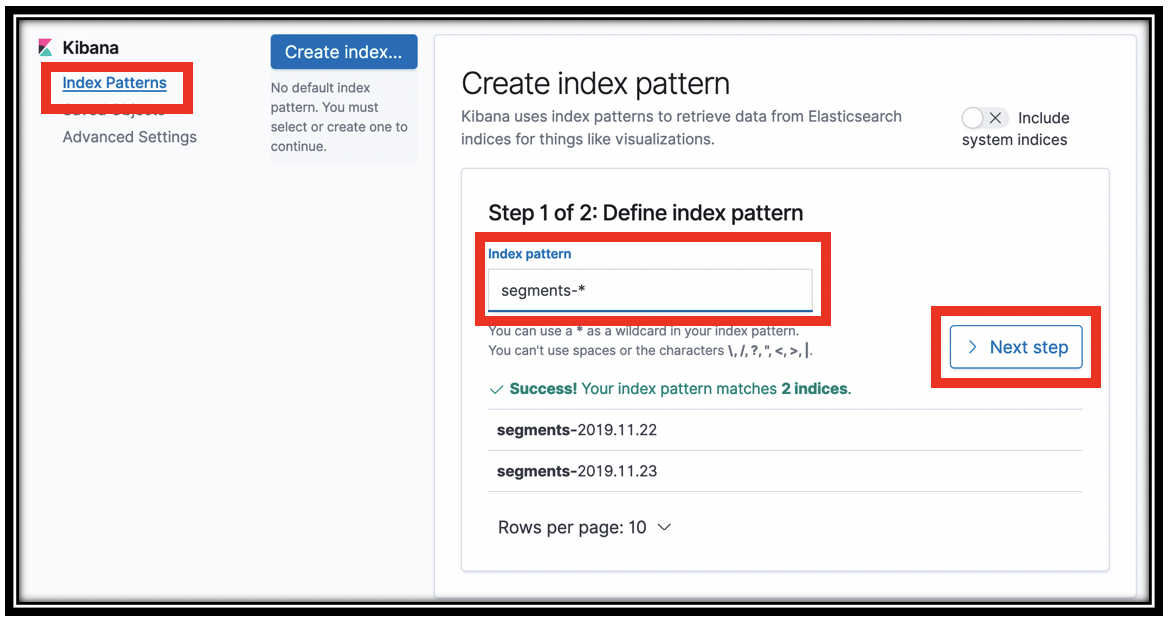
 - Click Index Patterns.
In the Index pattern field, type segments-* and click Next step
In step 2 of the wizard, choose \@timestamp from the Time Filter field name menu.
Click Create index pattern. Kibana queries Amazon ES to find the schema for these indexes and shows that schema to you.
Repeat the process by clicking the Create index pattern button to define an index pattern for summaries-* and appdata-*.
You’ve now set up Kibana with your indexes and their mappings to be able to create visualizations.
Use the Discover pane
The Discover pane provides an overview of the index pattern you select. It’s a quick-start location, where you first go to see that there is data in your index, search across that data, and see the fields and values of your documents.
- Click the
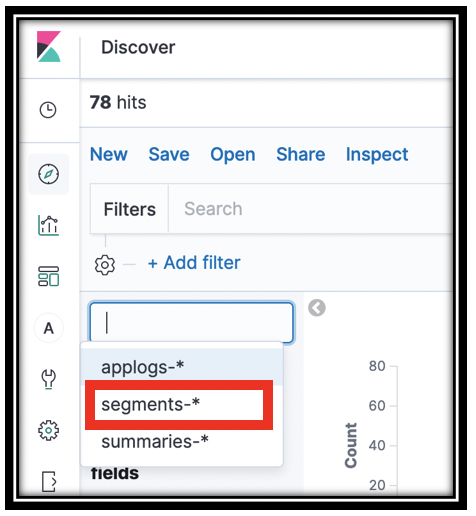
 in the left navigation pane to navigate to Kibana’s Discover panel.
 Make sure that you are looking at the segments-* index pattern. At the top left, drop down the index patterns menu, and select segments-*
Depending on the time elapsed from when you last worked with the Bookstore app, you might receive No results match your search criteria.
Drop down the time selector menu, which shows as a calendar icon at the top right of the screen. In the Commonly used section, click Today. The time selector keys off of the \@timestamp field of the index pattern.
You now have a histogram with the event counts for events that were logged to the segments-* index at the top of the screen.
Below that are sample records in the index. Use the disclosure triangle to open one of the segment records. When I did that, I found a Mock record. Well, that’s not what I want! Let’s employ Elasticsearch’s search function to narrow to relevant records!
In the Filters search box, type
trace_type:segmentto narrow the displayed documents to only segments. (Thetrace_typefield was added by theXRayPullerfunction to help route data into different Elasticsearch indexes. If you’re curious, you can have a look at the trace_details_sink.py file in that function)Open the disclosure triangle next to one of the records. You may be looking at a root segemnt, or one of the subsegments.
trace_details_sinkflattens the trace structure that X-Ray generates, producing a single record at each level of the tree. Examine the fields and values for some of the records to get a feel for this dataKibana can also show you a tabular view of your data. This is a powerful way to dig in and narrow to the interesting records. You can use this to find log lines that surface information about infrastructure problems. For example, you can quickly build a table of requests and result codes.
Hover over one of the field descriptions in an open document to reveal the icons on the left. Click the table icon to put that value in a table.
Add the Trace ID, http_response_code, aws_operation, aws_function_name, and any other fields that look interesting.
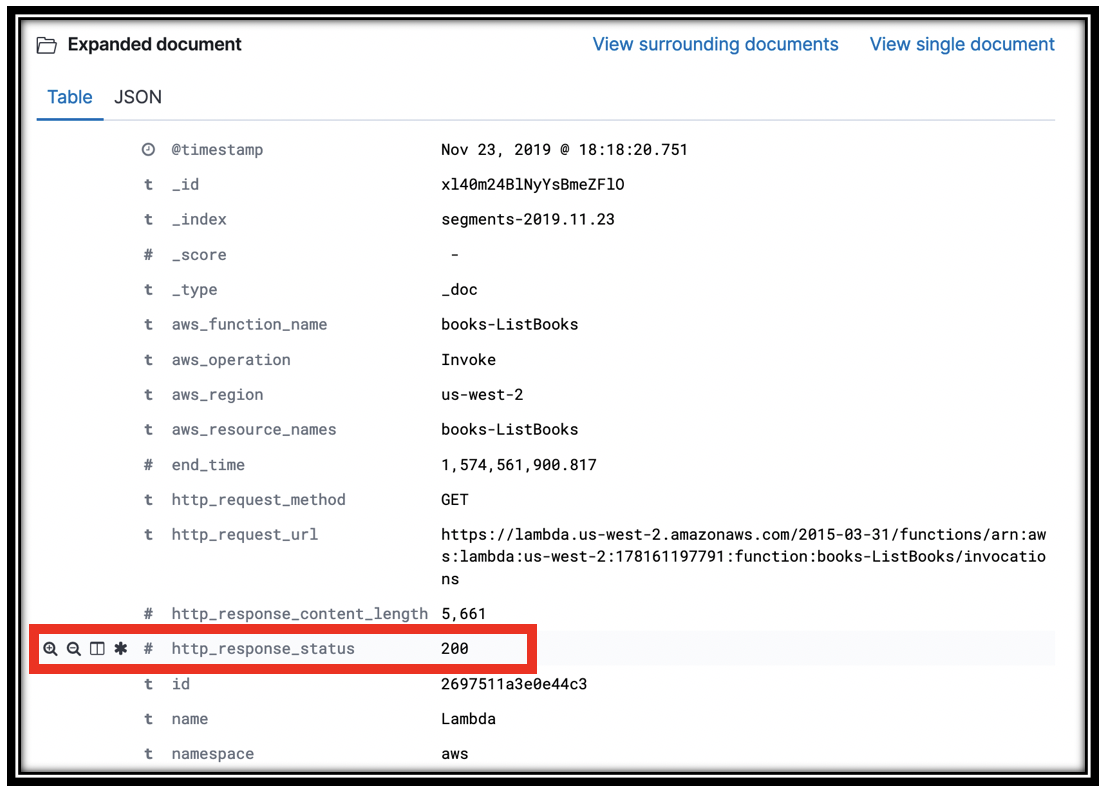
Scroll up to find the discover triangle and close it. You are now looking at a table with the rows you selected.
Find a row with 200 in the http_response_code. Hover over the value, to reveal 2 magnifying glasses, one with a plus sign and one with a minus. These are quick links that let you Filter for or Filter out a value. Click the magnifying glass with a minus sign to filter out segments with a 200 response.
You can remove this filter later at the top of the screen, right below the search bar.
Find a row with a 502 and Filter for that value to reveal the segments from the failed GetRecommendations calls you simulated above.